• REGISTER NOW!! Why? Because you can't do much without having been registered!

    At the moment you have limited access to view all discussions - and most importantly, you haven't joined our community. What are you waiting for? Registration is fast, simple and absolutely free so please, join Join Talking Horses here!

Some Stats

pawras

Apprentice
Joined
Nov 27, 2017
Messages
491
I have my own DB of past races, I generate my own kpi’s etc etc.

Anyway I’ve also loaded up the data that’s available from data.betfair.com so as to enhance my analysis, as such I have my version of bsp where by it’s the last price traded before the off, plus also record the price traded at around 700am.

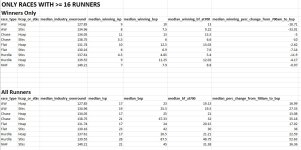
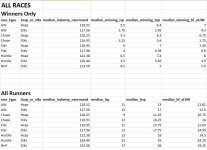
As such I did a bit of analysis to compare isp against my version of bsp and the 700am price and came up with the following. Note the betfair prices have had no commission deducted.

See what you think….

Median Odds All Races.jpg
 
Congratulations, pawras, on such an interesting first post.

What would you deduce from the stats?

On average in stakes races the difference between bsp and isp for the winner once you take commission into account is fag paper thin.
On average winners shorten on betfair from earlies to bsp by about 7%.
If you’re not trading etc then back early with BOG if possible.


Danny’s interest is primarily big field races so I produced this for him.
The amount that winners tends to shorten on betfair for AW races is quite dramatic , but that is because there are only a very small number of big field races on AW.
Median Odds 16plus runners.jpg
 
Last edited:
If you’re not trading etc then back early with BOG if possible.

Excellent. That indeed is my MO and Slim Chance has told me more than once it's the right way for me to operate given I pretty much need to get all my bets on by about 10.30am.
 
How 'statistically strong' is the OR broken down by GB and IRE, race type and hcap vs stks?

So if you blindly backed the stand alone top OR in each race since 2001 what would you get?


1738100061954.png
 
Mate your memory is better than Colssuss's if you remembered you'd posted this 7 years ago.
 
Here's the PRB2 (percentage runners beaten squared) data for all trainers with runners between 20250211 and 20250216 based on data up to and including 20250208

I show it at different timespans to give a view of whether a trainer is in or out of form compared to their long term.

Percentage runners beaten is more granular than just simple strike rates.

It's too big for a screenshot and you can't attach spreadsheets here so have attached it as pdf and have highlighted the stand out ones that seem in or out of form.
 

Attachments

Next time I look at the code for that I might add a new col showing how many runners they over the next week.

I have the same report but for jockeys but didn't have time to fk around creating pdfs and posting that one
 
As before here's my trainer PRB2 ratings covering different time periods for all trainers with runners between 25/02/25 and 02/03/25 using data up to and including 22/02/25. Allows you to see if a trainer is in or out of form. The last col "count of horses in last 365 days" as it's a distinct count it gives an indicative view of yard size.
Has some more time periods as it was requested by someone elsewhere.
I've highlighted the ones I view as particularly in or out of form.
If you don't know about PRB2 then an internet search will soon help
 

Attachments

Following my post here

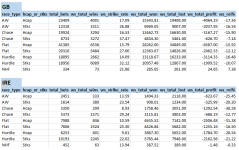
I felt inspired to do the stats to compare in the UK , IRE and HK , backing the stand alone top OR and my trainer PRB2 rating based off their last 365 days.


UK vs IRE vs HK - OR and Trainer PRB2-365.jpg
 
Last edited:
Being top OR seems more relevant in the UK than IRE & not really worth thinking about for hcaps in HK.

The results look interesting for the trainer prb2 rating in IRE chase hcap races.Only a 5% loss at isp over a big data set with no other considerations.
 
Thanks for sharing this. I'd like to be sure I'm understanding the data correctly, so please forgive my questions.

The left hand tables show the overall results of betting at level stakes on the highest rated horse in various types of races in the three countries?

And what exactly are the right hand tables showing? The results of betting at level stakes on any runners from in-form stables?

And in the pdf file, that last column showing numbers of horses per trainer: is it the number of horses that ran on the track in their name or the number registered as horses in training in their yard?

>>The left hand tables show the overall results of betting at level stakes on the highest rated horse in various types of races in the three countries?
Yes, blindly backing the stand alone top OR (i.e. if the top is 140 and more than one runner has that then no bet) to level stakes at ISP


>>And what exactly are the right hand tables showing? The results of betting at level stakes on any runners from in-form stables?
I'm into percentage runners beaten squared prb2 as a kpi (key performance indictator) for trainers by aggregating it up for set time period, in this case over the last 365 days prior to a race i.e "Trainer prb2 rating from last 365 days - backing any horse stand alone top rated"
This gives a more granular view of the trainer's performance than just wins vs losses or even wins & places vs losses.
So for any given race I have the trainer's prb2 rating derived from the 365 days prior to that race and I'm showing the results of blindly backing the stand alone top rated trainer prb2 at £1 level stakes to ISP.
Then by doing that for the same time period, race types and country as for the stand alone top OR it's showing a side by side comparison of the two quite different metrics.


>>And in the pdf file, that last column showing numbers of horses per trainer: is it the number of horses that ran on the track in their name or the number registered as horses in training in their yard?
The pdf file posted on 25/02/25 showed for all trainers with runners in the forth coming races, all courses, between 25/02/25 and 02/03/25, their calculated prb2 ratings for different time periods , the last 365 days being one of them, so as to get a view of their overall performance compared to other trainers with runners in that time period and whether they were particularly in or out of form.
The last column "count of horses in last 365 days" is a count of the distinct number of horses a trainer has sent out over the last 365 days (distinct as in if horseA runs 10 times it still only counts as 1) , this gives an indicative view (i.e. estimate not definitive) of the size of their yard.
 
Last edited:
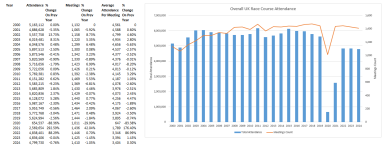
If you look at the figures for 2022 - 2024, looks like UK racing is facing a new reality for attendance post covid

1747737832427.png
 
Between Brexit and Covid, everything is much more expensive. People are thinking much more carefully about where and how to spend their disposable income, what little there is of it, and racing is well down the line.

The industry isn't helping itself with the price of entry and on-course catering, which rip people off.

But everywhere is at it.

In 2003 I had a week all-inclusive, flying from Glasgow, in Benidorm, in a 5-star hotel. It cost £254. (I recall when I got home saying if it had cost me £354 is would have been good value.)

I did the same holiday in the same hotel in 2013. It cost £325.

In 2017 I had a week AI in a 4* there. It was £399.

This year it would be over £1000.
 
Some thoughts :

Looking at the total attendance figures 2000 to 2019 and the associated number of meetings, suggests that even though the number of meetings have increased significantly, the overall number of people attending race meetings didn’t grow. Instead there has been a gradual decrease in the average attendance per meeting.

Could the accumulated chagrin created by various factors be causing people’s interest in horse racing to wane?
· Ticket prices & food/drink costs on course are seen by many as being excessively high. It can be argued that increased overheads such as energy costs haven’t helped.
· Courses introducing card only payments everywhere, Last couple of times at Newbury I couldn’t even buy a cup of coffee from a van near the parade ring without a card, puts me off going
· Bookmakers routinely restricting, to effectively ban, punters who are or even look like being profitable over even a relatively short term.
· Bookmakers making it as onerous as possible to collect one’s winnings by asking for bank statements and proof of income. Whereas someone could lose £1000’s day after day gambling on the lottery and its pernicious scratch cards with no questions asked.
· The message pushed by the anti-horse racing groups not being effectively tackled and negative images such as the Gordon Elliot debacle gifting them negative PR.
· Post-covid cost-of-living crisis is often cited but the 2007-2008 financial crisis didn’t create a significant drop in attendance.
Dunno about affordability checks with the National Lottery but I recently had a pretty poor experience with them.

I had an old card registered with them that had expired. I wanted to deposit some funds so I went on to change my card details - it said that because I had £1.60 still in my account I couldn't change the card before withdrawing said funds.

Because the card had expired, it wouldn't let me withdraw the funds. You can see the vicious circle developing here.....

Tried various means to resolve it (couldn't get a hold of their customer services) but all to no avail.

Eventually sent in a complaint to them, which ended with a response saying, essentially, speak to customer services we're not doing anything with it.

Several days later managed to get a hold of someone and finally got the problem resolved. But the whole process was far more painful than it should have been.
Lol the veins on my forehead are throbbing just thinking about that, all it needed is where you were on some robotic answering service where at the end of going to down the decision tree it just hangs up rather than connect you to someone.
 
Having attended York races for the Musidora last week I found the day more enjoyable due to the reduced attendance.
My County Stand badge would have set me back £39 but fortunately I got it free due to Rewards for Racing offering a discount code for the Aintree festival which I sneakily used to buy my York badge with.
I spent a lot of time on the racecourse with a friend in the Granstand and Paddock enclosure which was even quieter than the members enclosure.
Have noticed that the cost of tickets for the Wednesday of the Ebor meeting (Juddmonte International) are on sale at the early bird prices of:
County Stand £76
Grandstand & Paddock £43
(if like me you are over 65 you can get this for the amazing price of £42 providing you can produce Identification of course).

The course is absolutely immaculate but if they keep increasing their prices they will price their selves out of the game.

Price of a pint was £7.50 which is about par for the course ( a friend of mine was charged £9.25 a pint at the Darts League in Leeds the other week) so it felt rather cheap!!!).

I used to stop in York for the three days but now you cannot get a decent room for less than £100 per night if you can find one that is in racing week.

In 2004 I was stopping in New York and dragged my wife and son to Belmont races for a Sunday afternoon meeting
It cost less than $10 entry fee for all of us!!!!
 
Pawras -would you have any stats regarding amounts matched per race on betfair.
I did have a load of betfair data and stats until about 2018, then they completely changed the free data made available , sinve then I've never had the time or inclination to write the code to process the new format.
 
Trifecta ot Tricast?
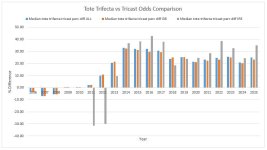
I did a comparison of the returns in races where both are offered and calculated the median % difference for each year up until last week. Plus I've shown the difference betweem UK and IRE.
Bottom line on avg trifectas give better returns than tricasts in the same race.

trifecta vs tricast.JPG
 
Last edited:


Write your reply...
Back
Top