Thanks for sharing this. I'd like to be sure I'm understanding the data correctly, so please forgive my questions.
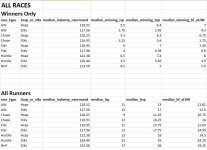
The left hand tables show the overall results of betting at level stakes on the highest rated horse in various types of races in the three countries?
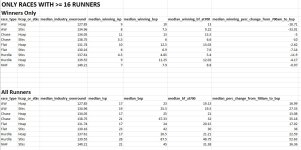
And what exactly are the right hand tables showing? The results of betting at level stakes on any runners from in-form stables?
And in the pdf file, that last column showing numbers of horses per trainer: is it the number of horses that ran on the track in their name or the number registered as horses in training in their yard?
>>The left hand tables show the overall results of betting at level stakes on the highest rated horse in various types of races in the three countries?
Yes, blindly backing the stand alone top OR (i.e. if the top is 140 and more than one runner has that then no bet) to level stakes at ISP
>>And what exactly are the right hand tables showing? The results of betting at level stakes on any runners from in-form stables?
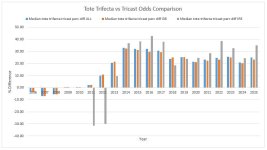
I'm into percentage runners beaten squared prb2 as a kpi (key performance indictator) for trainers by aggregating it up for set time period, in this case over the last 365 days prior to a race i.e "Trainer prb2 rating from last 365 days - backing any horse stand alone top rated"
This gives a more granular view of the trainer's performance than just wins vs losses or even wins & places vs losses.
So for any given race I have the trainer's prb2 rating derived from the 365 days prior to that race and I'm showing the results of blindly backing the stand alone top rated trainer prb2 at £1 level stakes to ISP.
Then by doing that for the same time period, race types and country as for the stand alone top OR it's showing a side by side comparison of the two quite different metrics.
>>And in the pdf file, that last column showing numbers of horses per trainer: is it the number of horses that ran on the track in their name or the number registered as horses in training in their yard?
The pdf file posted on 25/02/25 showed for all trainers with runners in the forth coming races, all courses, between 25/02/25 and 02/03/25, their calculated prb2 ratings for different time periods , the last 365 days being one of them, so as to get a view of their overall performance compared to other trainers with runners in that time period and whether they were particularly in or out of form.
The last column "count of horses in last 365 days" is a count of the distinct number of horses a trainer has sent out over the last 365 days (distinct as in if horseA runs 10 times it still only counts as 1) , this gives an indicative view (i.e. estimate not definitive) of the size of their yard.
