-
REGISTER NOW!! Why? Because you can't do much without having been registered!
At the moment you have limited access to view all discussions - and most importantly, you haven't joined our community. What are you waiting for? Registration is fast, simple and absolutely free so please, join Join Talking Horses here!
You are using an out of date browser. It may not display this or other websites correctly.
You should upgrade or use an alternative browser.
You should upgrade or use an alternative browser.
Spreads, System(atic) Betting & Staking Plans
- Thread starter NumberCruncher
- Start date
NumberCruncher
Amateur Rider
NumberCruncher
Amateur Rider
NumberCruncher
Amateur Rider
NumberCruncher
Amateur Rider
I used the spare time yesterday to enhance the spreadsheets so that I now have the running totals automatically populated, and it confirmed that handicaps class 4-6 is still the general area with the best results. That's just my way of pulling out some selections to help demonstrate the RFSP though, it's not how I will ultimate identify selections.
I've previously mentioned that I'm tracking a range of criteria, but within that I categorise them with what I thought would be the strongest selections (A1) through to the weakest (C4).
Ignoring the overall totals below (which is a sum of everything), the sub totals are the sums of the filtered options, which is where the selections I'm posting come from (i.e. including everything in A1 to C4 for these filters)) .
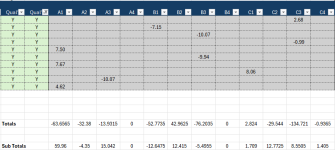
This helps to explain where I'm heading with the systematic approach. The first phase is information gathering, and then I'll use that to inform the strategy going forward. I haven't applied any filters for class here, this includes selections that were up to class 2, and quite a few from Irish meetings. A1 is clearly ahead of the other categories, and if I apply the 40 selections to a RFSP, I get the following results:

Worth noting again that the figures will be enhanced because the selection process is based on previous winners, so I'm not counting on producing something with a 15% ROI. There are a couple of other things I want to bring into the mix, and I'm hoping that I can identify 3 or 4 specific sets of rules that will generate a profit long term. I'll then take those into the flat season in the hope that I can achieve similar results, and certainly into the next jumps season to make sure they are repeatable.
I've also learnt from my Adrian Massey experience not to rely on a single set of ratings, so will subscribe to another ratings service for the flat season and start analysing those in parallel. Ultimate aim is to have at least 3 ratings in the mix, and some of the rules may then be to back selections where multiple ratings are in agreement.
I've previously mentioned that I'm tracking a range of criteria, but within that I categorise them with what I thought would be the strongest selections (A1) through to the weakest (C4).
Ignoring the overall totals below (which is a sum of everything), the sub totals are the sums of the filtered options, which is where the selections I'm posting come from (i.e. including everything in A1 to C4 for these filters)) .

This helps to explain where I'm heading with the systematic approach. The first phase is information gathering, and then I'll use that to inform the strategy going forward. I haven't applied any filters for class here, this includes selections that were up to class 2, and quite a few from Irish meetings. A1 is clearly ahead of the other categories, and if I apply the 40 selections to a RFSP, I get the following results:

Worth noting again that the figures will be enhanced because the selection process is based on previous winners, so I'm not counting on producing something with a 15% ROI. There are a couple of other things I want to bring into the mix, and I'm hoping that I can identify 3 or 4 specific sets of rules that will generate a profit long term. I'll then take those into the flat season in the hope that I can achieve similar results, and certainly into the next jumps season to make sure they are repeatable.
I've also learnt from my Adrian Massey experience not to rely on a single set of ratings, so will subscribe to another ratings service for the flat season and start analysing those in parallel. Ultimate aim is to have at least 3 ratings in the mix, and some of the rules may then be to back selections where multiple ratings are in agreement.
NumberCruncher
Amateur Rider
No more qualifiers recently, so I'll take up the option I mentioned previously of tweaking the selection process. I'll be incorporating the A1 items across the board, and will also start using the rating option in RFSP where different percentages are staked depending on whether a bet is rated A, B or C. A will be set to 2.5%, B 2% and C 1.5%. The C's are basically the selections previously advised with the A1's excluded, and I'll almost certainly drop those longer term if the results don't improve.
The new selection process would have resulted in 193 bets since 1st November, 22 rated A, 53 rated B and 118 rated C. I think it will make sense to re-set the bank at this point, and I'll continue to show progress against a traditional bank and level stakes.
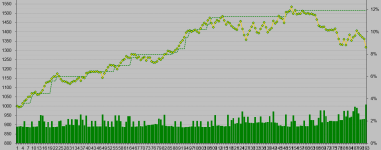
The as-if results also highlight the potential issues with the loss recovery element. Plugging in those 193 bets with the A-C ratings produces this result.

The actual average plays calculates at 3, but I manually input 20 to reduce the rate at which stakes increase after a loss. On this basis, the highest bet (green bar) reaches 3.5% of bank (which I can live with).
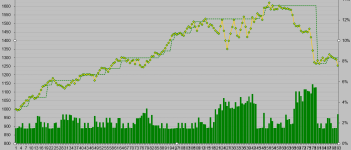
Using exactly the same bets and ratings, but with the average plays set to 3, the highest bet reaches 5.8% and triggers the circuit breaker.

I'll produce a mock up (probably at the weekend) of the selection process using data from the Racing Post site. It's not information I actually use, but will provide an example that everyone can relate to.
The new selection process would have resulted in 193 bets since 1st November, 22 rated A, 53 rated B and 118 rated C. I think it will make sense to re-set the bank at this point, and I'll continue to show progress against a traditional bank and level stakes.
The as-if results also highlight the potential issues with the loss recovery element. Plugging in those 193 bets with the A-C ratings produces this result.

The actual average plays calculates at 3, but I manually input 20 to reduce the rate at which stakes increase after a loss. On this basis, the highest bet (green bar) reaches 3.5% of bank (which I can live with).

Using exactly the same bets and ratings, but with the average plays set to 3, the highest bet reaches 5.8% and triggers the circuit breaker.


I'll produce a mock up (probably at the weekend) of the selection process using data from the Racing Post site. It's not information I actually use, but will provide an example that everyone can relate to.
NumberCruncher
Amateur Rider
Finally have something to get me re-started.
12.55 Doncaster - Yealand / Salt Rock - Buy @ 1.5 (Sporting Index & Spreadex)
12.55 Doncaster - Yealand / Salt Rock - Buy @ 1.5 (Sporting Index & Spreadex)
NumberCruncher
Amateur Rider
One more today
19.15 - Shamardia / Bomb Squad - Sell @-0.5 (Sporting Index)
19.15 - Shamardia / Bomb Squad - Sell @-0.5 (Sporting Index)
NumberCruncher
Amateur Rider
Results from yesterday are:

I’ve also added the Racing Post data for a single race to a spreadsheet so that I can explain how I’m using similar data. Nothing I outline here is actually included in my method, it’s just an explanation of the different types of data available, and how I would use it. The next few posts should help everyone decide whether I'm absolutely bonkers for doing this, or maybe there could be something worth looking into
The first few columns show the race details, followed by data items relating to each horse individually. The weight adjustment is showing jockey claim in this case, but I’d expect to take account of any recent win penalties as well and combine for weight adjustments.

You can drill down on the Racing Post card to obtain information about previous runs, and when added to a spreadsheet with most recent run to the left, would look like this:


I’ve also added the Racing Post data for a single race to a spreadsheet so that I can explain how I’m using similar data. Nothing I outline here is actually included in my method, it’s just an explanation of the different types of data available, and how I would use it. The next few posts should help everyone decide whether I'm absolutely bonkers for doing this, or maybe there could be something worth looking into
The first few columns show the race details, followed by data items relating to each horse individually. The weight adjustment is showing jockey claim in this case, but I’d expect to take account of any recent win penalties as well and combine for weight adjustments.

You can drill down on the Racing Post card to obtain information about previous runs, and when added to a spreadsheet with most recent run to the left, would look like this:

NumberCruncher
Amateur Rider
You also need to make sure that you understand what the data represents, and the RPR is a perfect example of this. When looking at the RPR for todays race, it represents what the racing post ratings method considers to be the horses ability for the race conditions today. When looking at the previous runs, it gets adjusted to reflect the actual performance in the race.
Taking Ginny's Destiny as an example, the last race shows a rating of 142. However, the card produced on the day had Ginny's Destiny rated at 172 and the lower rating applied now reflects the fact that GD came 3rd and was beaten by 13.5 lengths.
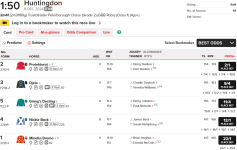
It doesn't mean to say that you can't use the historic data, just that you need to make sure the use case makes sense. If I wanted to identify a difference in RPR that suggested horse A would beat horse B, I wouldn't be able to use the historic data. But if I wanted to calculate an average performance over past runs, the rating being changed to reflect actual performance would be useful in that case.
Taking Ginny's Destiny as an example, the last race shows a rating of 142. However, the card produced on the day had Ginny's Destiny rated at 172 and the lower rating applied now reflects the fact that GD came 3rd and was beaten by 13.5 lengths.

It doesn't mean to say that you can't use the historic data, just that you need to make sure the use case makes sense. If I wanted to identify a difference in RPR that suggested horse A would beat horse B, I wouldn't be able to use the historic data. But if I wanted to calculate an average performance over past runs, the rating being changed to reflect actual performance would be useful in that case.
NumberCruncher
Amateur Rider
The data that I'm recording is a mix of actual ratings applied by the service I've subscribed to, some calculations that I apply using those ratings (e.g. an average of past performances), other elements that I think show specific attributes (e.g. suggest that a horse has been improving), and then items that might be considered to favour one horse over another.
Using the racing post data on that last point, you may think that the number of tipsters is useful information, and back Horse A over Horse B if the score is plus 3 tipsters in favour of your selection. Or you may like to use the CD info as an indicator, making sure your selection is a course and distance winner and the other isn't. And to be clear, I'm not suggesting these are useful indicators, and I don't use that info myself.
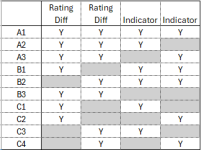
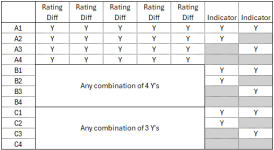
Once you have a list of items to review, you can then batch them together to identify which appear to have most effect over a period. The combinations I use end up in tables like this


NumberCruncher
Amateur Rider
It might sound like a lot of effort to collect the data, but most info I use comes from the ratings service. The only info I need to collect myself is the class of the race, the matchbet spreads and the race result (i.e. the winning or losing distance).
Once the matchbets for Cheltenham are posted, I'll see what the RP data might suggest.
Once the matchbets for Cheltenham are posted, I'll see what the RP data might suggest.
NumberCruncher
Amateur Rider
The matchbets for the 1.50 today pitch Ginny's Destiny against Imperial Saint, and Moon D'Orange against Some Scope. Looking at the racing post data available to non subscribers, there's a number of items that favour one over the other in each case, but is it enough to make a selection?
Ginny's Destiny scores 6 higher in RPR, and when you calculate the average RPR over the last 6 runs, GD comes out nearly 20 points up (GD 155 vs IS 131.5). The TS rating though would be inconsistent, with GD scoring 25 lower on todays rating, but over 30 points higher for the average in the last 6 runs. Other factors that may be considered is GD is winner over course and distance, but IS only a distance winner, and GD wins 4/3 on number of tips.
Moon D'Orange is 3 lower than Some Scope in RPR and nearly 20 in RPR average (MDO 79.33 vs SS 96.6). But on the flip side, MDO is a distance winner and has 3 tips, where SS has neither.
Taking all of that into account, you might decide to back GD over IS, but not MDO over SS. Again, I'm not suggesting anyone should use these rules specifically, just highlighting my approach to selections in that if there are enough positive attributes for one over the other, I have a bet.
